Enter your hitting or pitching stats below and get instant results with performance ratings. Or scroll down for how each stat is calculated.

Calculate Your Stats
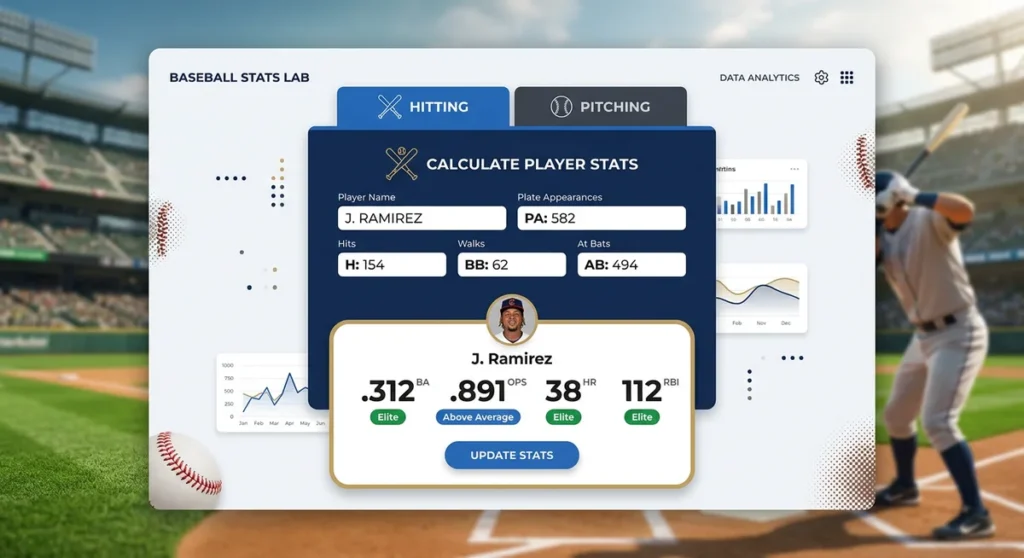
This calculator computes all major hitting stats (BA, OBP, SLG, OPS, Total Bases) and pitching stats (ERA, WHIP) from raw box score numbers. Enter your figures in the Hitting or Pitching tab and get instant results with MLB-calibrated performance ratings. Works for baseball and softball — adjust innings per game for 7-inning formats.
How Each Stat Is Calculated
Hitting Stats
Batting Average (BA) = Hits ÷ At Bats
The most basic hitting stat. A .300 BA means you get a hit 30% of the time you put the ball in play. Simple, but it misses walks entirely — a player who walks 100 times looks the same as one who walks 10 times.
On-Base Percentage (OBP) = (Hits + BB + HBP) ÷ (AB + BB + HBP + SF)
OBP fixes what batting average misses — it counts every way a batter reaches base. A .400 OBP means the batter reaches base 40% of the time. Most coaches and front offices now value OBP more than BA because getting on base creates runs.
Slugging Percentage (SLG) = Total Bases ÷ At Bats
Where Total Bases = Singles + (2 × Doubles) + (3 × Triples) + (4 × Home Runs). SLG measures power. A single and a home run are the same in batting average — both are “hits.” In slugging, a home run is worth four times as much.
OPS (On-Base Plus Slugging) = OBP + SLG
The all-in-one hitting stat. OPS combines a batter’s ability to get on base AND hit for power into one number. It’s the fastest way to evaluate a hitter’s overall offensive contribution.
Total Bases = 1B + (2 × 2B) + (3 × 3B) + (4 × HR)
The raw counting stat behind slugging percentage. Total bases tells you exactly how many bases a player earned through hits alone.
Pitching Stats
ERA (Earned Run Average) = (Earned Runs × Game Innings) ÷ Innings Pitched
ERA tells you how many runs a pitcher allows per full game. An ERA of 3.00 means the pitcher allows 3 earned runs per 9 innings on average. “Earned” means runs that scored without errors.
WHIP (Walks + Hits per Inning Pitched) = (BB + Hits Allowed) ÷ Innings Pitched
WHIP measures how many baserunners a pitcher allows per inning. Lower is better. WHIP catches something ERA misses — a pitcher can have a decent ERA while putting runners on base constantly if they strand them.
Performance Ratings — What’s “Good”?
MLB hitting benchmarks: .300+ BA is excellent, .400+ OBP is elite, .500+ SLG is excellent, .900+ OPS is All-Star level. Pitching benchmarks: below 2.50 ERA is elite, below 1.10 WHIP is excellent. High school and youth averages run higher than MLB because pitching is less dominant — context the level of play before comparing numbers.
Hitting Benchmarks
| Rating | BA | OBP | SLG | OPS |
|---|---|---|---|---|
| .320+ | .400+ | .550+ | .950+ | |
| .300–.319 | .370–.399 | .500–.549 | .900–.949 | |
| .270–.299 | .340–.369 | .440–.499 | .800–.899 | |
| .250–.269 | .320–.339 | .400–.439 | .700–.799 | |
| .230–.249 | .300–.319 | .350–.399 | .650–.699 | |
| <.230 | <.300 | <.350 | <.650 |
Context matters. These benchmarks are for MLB. High school and college averages run higher because pitching is less dominant.
Pitching Benchmarks
| Rating | ERA | WHIP |
|---|---|---|
| <2.50 | <0.95 | |
| 2.50–3.00 | 0.95–1.10 | |
| 3.00–3.50 | 1.10–1.20 | |
| 3.50–4.00 | 1.20–1.30 | |
| 4.00–4.50 | 1.30–1.40 | |
| >4.50 | >1.40 |
ERA can lie. A pitcher with a 3.50 ERA and a 1.40 WHIP is getting lucky — they’re putting too many runners on base and eventually those runs will score. WHIP is the better predictor of future performance.
Why OPS Matters More Than Batting Average
OPS (On-Base Plus Slugging) is the most widely used all-in-one hitting stat because it captures both plate discipline (OBP) and power (SLG). A player with a .260 BA but a .380 OBP and .480 SLG (.860 OPS) is more valuable than a .310 BA hitter with a .340 OBP and .400 SLG (.740 OPS). MLB tracking confirms OPS correlates with run production better than any single traditional stat.
Batting average dominated baseball analysis for a century. It’s clean, simple, and every fan understands it. But it has a fundamental flaw: it treats all hits equally and ignores walks entirely.
Consider two players:
- Player A: .310 BA, .340 OBP, .400 SLG → .740 OPS
- Player B: .270 BA, .380 OBP, .480 SLG → .860 OPS
Player A has the better batting average by 40 points. But Player B reaches base more often (walks), hits for more power (extra-base hits), and creates more runs. By OPS, Player B is clearly better — and the data backs it up.
This is why front offices shifted from BA to OPS — batting average tells you part of the story. OPS tells you most of it.
What Counts as an At-Bat?
At-bats include hits, outs by swinging or called strikes, fielder’s choice, and reaching on error. They do NOT include walks, hit-by-pitch, sacrifice bunts, sacrifice flies, or catcher’s interference. This distinction matters because OBP uses plate appearances (all of the above) as its denominator — that’s why a player’s OBP can be significantly higher than their BA.
The most common mistake when calculating batting average is including plate appearances that aren’t at-bats.
Counts as an At-Bat: Any hit, any out where the batter swung or was called out on strikes, fielder’s choice, reaching on an error.
Does NOT count: Walk (BB), hit by pitch (HBP), sacrifice bunt, sacrifice fly, catcher’s interference.
This is why OBP uses plate appearances (AB + BB + HBP + SF) as the denominator instead of just at-bats — it captures every time the batter came to the plate.
How to Count Partial Innings
Baseball records partial innings in thirds — 5.1 IP means 5 innings plus 1 out (not 5.1 decimal innings). For ERA and WHIP math, convert: 5.1 = 5.333, 5.2 = 5.667. This calculator accepts complete innings and additional outs separately and converts automatically so the ERA/WHIP formulas use the correct decimal value.
When calculating ERA and WHIP, partial innings matter. Baseball records innings pitched in thirds:
- 5.0 IP = 5 complete innings (15 outs)
- 5.1 IP = 5 innings + 1 out = 5.333 in decimal
- 5.2 IP = 5 innings + 2 outs = 5.667 in decimal
Our calculator handles this automatically — enter complete innings and additional outs separately.
Frequently Asked Questions
Batting average = Hits ÷ At Bats. Walks, hit-by-pitches, and sacrifice flies don’t count as at-bats — only plate appearances where the batter put the ball in play or struck out.
Batting average = Hits ÷ At Bats. If a player has 45 hits in 150 at-bats, their batting average is 45 ÷ 150 = .300. Remember that walks, hit-by-pitches, and sacrifice flies don’t count as at-bats — they’re plate appearances but not at-bats. This is the most common calculation error.In MLB, .300+ is excellent and the league average hovers around .245–.255. High school hitters average higher (.300–.380 for strong players) because pitching is less advanced. Focus on contact consistency over the raw number at youth levels.
In MLB, .300 or above is considered excellent — only about 10-15 players hit .300+ in a typical season. The league-wide average hovers around .245-.255. For high school baseball, averages tend to be higher (.350-.400 for strong hitters) because the pitching is less advanced. For youth leagues, focus less on the number and more on whether the player is making consistent contact.ERA = (Earned Runs × 9) ÷ Innings Pitched. For 7-inning games (high school, softball), use 7 as the multiplier instead of 9. Only earned runs count — errors that allow runners to score don’t go against the pitcher.
ERA = (Earned Runs × 9) ÷ Innings Pitched. If a pitcher allows 12 earned runs in 45 innings pitched, their ERA is (12 × 9) ÷ 45 = 2.40. The “9” represents a full 9-inning game. For leagues that play 7-inning games (high school, some college doubleheaders), adjust the multiplier to 7 — our calculator lets you set the game length.OPS = On-Base Percentage + Slugging Percentage. It’s the fastest all-in-one hitting stat. An .800 OPS is above average, .900+ is excellent, and 1.000+ is elite — only the very best hitters sustain that over a full season.
OPS stands for On-Base Plus Slugging. It adds a player’s On-Base Percentage (how often they reach base) to their Slugging Percentage (how many total bases they average per at-bat). An .800 OPS is above average, .900+ is excellent, and 1.000+ is elite — only the very best hitters maintain an OPS above 1.000 over a full season.Batting average counts only hits ÷ at-bats. OBP counts every way you reach base (hits + walks + HBP) ÷ total plate appearances. A patient hitter who walks 80 times can have a .370 OBP despite a .260 BA — that 110-point gap is entirely from walks batting average ignores.
Batting average only counts hits divided by at-bats. On-base percentage counts every way a batter reaches base (hits, walks, hit-by-pitch) divided by total plate appearances. A player who walks a lot will have an OBP significantly higher than their BA. For example, a .260 hitter who draws 80 walks might have a .370 OBP — that 110-point gap is entirely from walks and HBPs.WHIP = (Walks + Hits) ÷ Innings Pitched. A 1.00 WHIP means one baserunner per inning. It matters because a pitcher with a low ERA but high WHIP is stranding runners and getting lucky — that luck predicts worse future ERA.
WHIP (Walks + Hits per Inning Pitched) measures how many baserunners a pitcher allows per inning. A 1.00 WHIP means roughly one baserunner per inning. WHIP matters because it predicts future ERA better than ERA itself — a pitcher with a low ERA but high WHIP is likely getting lucky (stranding runners), and that luck will run out.SLG = Total Bases ÷ At Bats, where Total Bases = (Singles × 1) + (Doubles × 2) + (Triples × 3) + (Home Runs × 4). A .500 SLG means the batter averages half a base per at-bat — solidly above average.
Slugging Percentage = Total Bases ÷ At Bats. Total Bases = (Singles × 1) + (Doubles × 2) + (Triples × 3) + (Home Runs × 4). If a player has 30 singles, 10 doubles, 2 triples, and 8 home runs in 200 at-bats, their total bases are 30 + 20 + 6 + 32 = 88, and SLG = 88 ÷ 200 = .440.Yes — all formulas are identical. The only adjustment is game length: set innings per game to 7 (not 9) for softball so the ERA calculation reflects a 7-inning game correctly.
Yes. The formulas for BA, OBP, SLG, OPS, ERA, and WHIP are identical in baseball and softball. The only difference is the game length — softball games are typically 7 innings instead of 9, which affects ERA. Our calculator lets you set the innings per game (default is 9, change to 7 for softball) so the ERA calculation adjusts automatically.Below 2.50 is good, below 1.50 is excellent for high school (7-inning games). High school ERAs are more volatile than MLB due to lower pitch counts and smaller sample sizes — don’t over-interpret a single-game ERA.
In high school baseball, a “good” ERA is typically below 2.50 and an “excellent” ERA is below 1.50. High school games are 7 innings, so the ERA formula uses 7 instead of 9 as the multiplier. Compared to MLB benchmarks, high school ERAs tend to be more extreme — top pitchers dominate more, but pitch counts and innings limits mean smaller sample sizes and more volatility.